

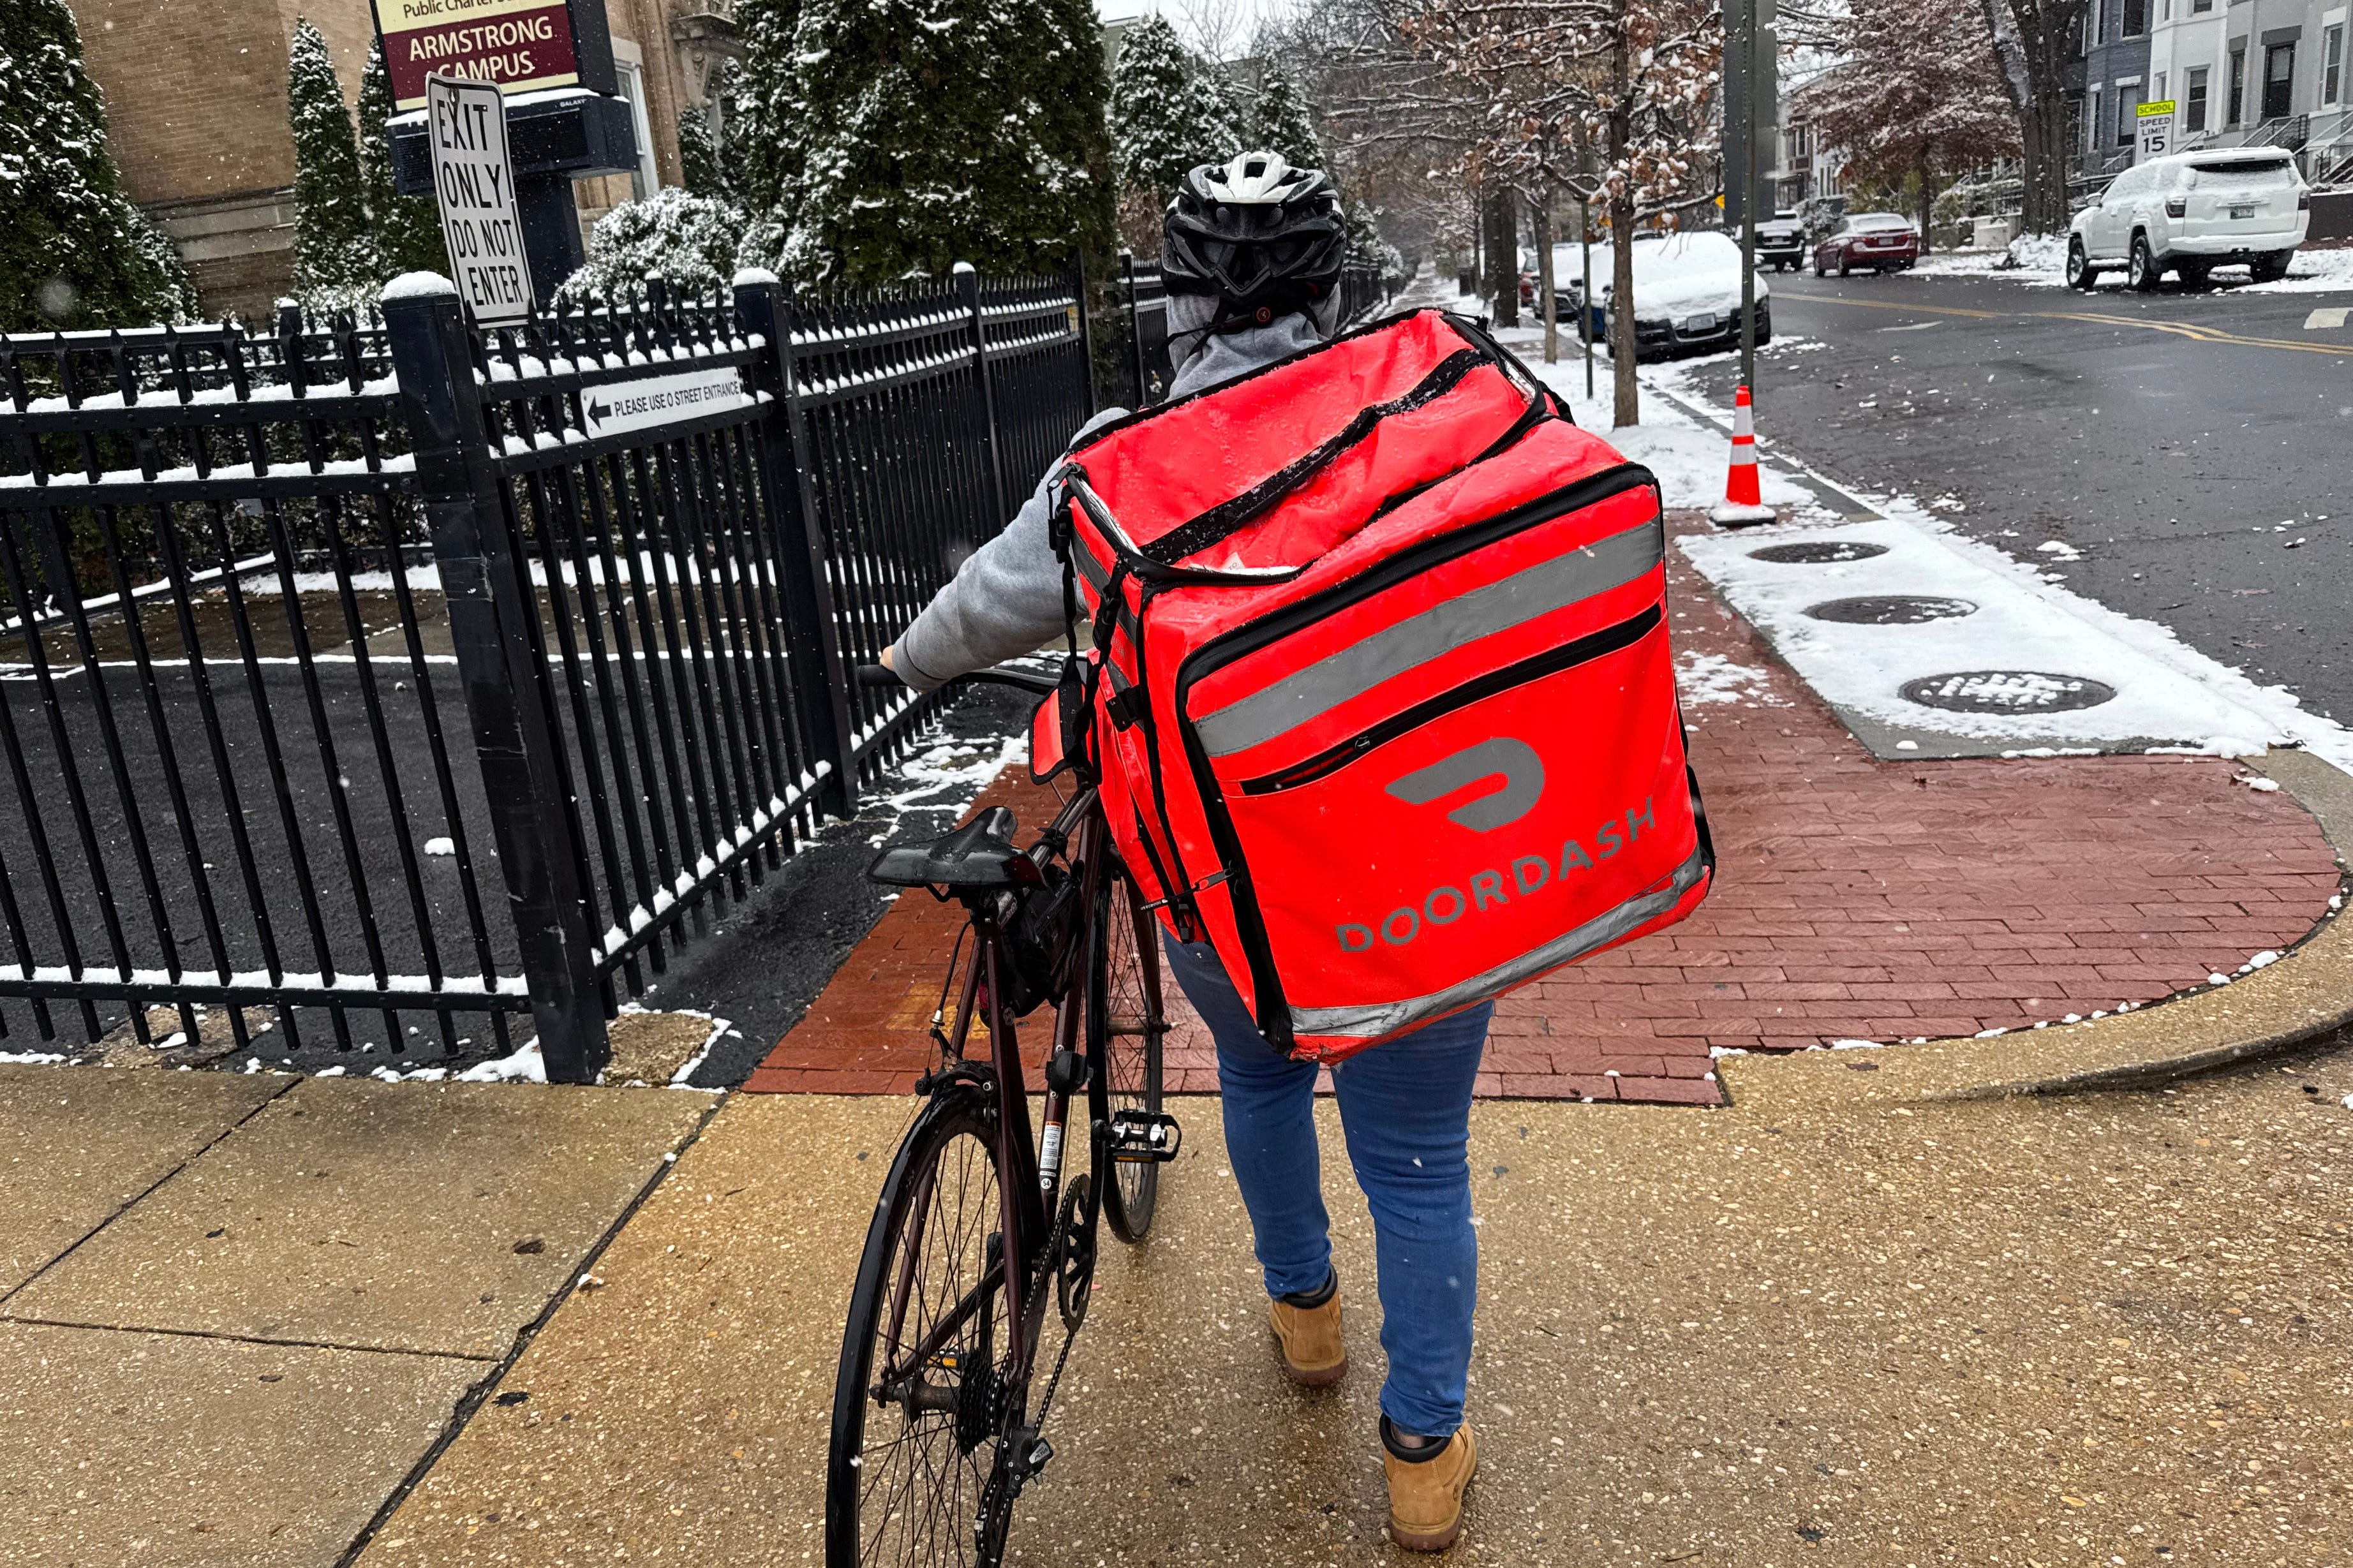
Who's really ordering all that DoorDash?
The food delivery discourse is pundit projection


Nearly 75% of all restaurant meals are consumed off-premises. Takeout and drive-thru play a large part, but in recent years, the explosion of meal delivery through platforms like DoorDash has fundamentally reshaped consumption patterns.
The New York Times recently published an article with instantly viral anecdotes of what can only be described as incredibly poor financial decision-making. One young woman described spending $200 to $300 per week on DoorDash while making just $50,000 a year. Another man admitted to spending $700 per week on ordering in, with the Times including a photo of his expensive (and apparently unused) copper pots and pans.
These anecdotes naturally led to a round of mockery online of the “Wow, kids these days are so financially irresponsible” variety. “DoorDash: Is this Gen Z’s avocado toast?”
But Americans actually spend relatively less on “food away from home” than they did 30 years ago.1 In fact, Americans are spending more on groceries and less on “food away from home,” with the largest substitutions taking place among low-income households.
The Argument columnist Matt Yglesias argued that, to the extent that some people are spending relatively more on DoorDash and other food delivery services, that’s a sign of increasing affluence. Cooking, meanwhile, is increasingly becoming less of a daily necessity and more of a fun hobby for enthusiasts.
But we wanted to know what the data said about food delivery. So we gave Claude Code data on credit and debit card transactions and household income from 39 million people to see what’s really going on.
So, who’s ordering all that DoorDash? Not Gen Z, as it turns out — the real culprits are middle-aged millennials.
Claude Code is really powerful (Skip this section if you want to get straight to the results!)
Before we get to the results, we want to explain how we got them. We provided Claude Code with links to The New York Times article and Yglesias’ column for context, along with two datasets, which we obtained from Yale’s Data-Intensive Social Science Center:
We obtained data on food delivery spending from an anonymized dataset derived from a major debit and credit card-network panel that captures billions of transactions annually from 39 million individuals across hundreds of merchants. We gave Claude an extract of that data from the last three months of 2025, with transactions from DoorDash, Grubhub, Postmates, and Uber Eats — the four largest food delivery services in the United States.2 This dataset provided the number and total dollar amount of food delivery transactions by age, income range, and county.
We then merged that data with population estimates from the American Community Survey’s five-year microdata (from 2019 through 2023), which allowed us to calculate per-capita spending rates. This data only identified large counties (generally those with populations over 100,000), which means our analysis only covers food delivery patterns in urban and suburban areas.
Note that we scaled up all food delivery data from quarterly to annual (meaning we multiplied by four) for this piece. It’s possible that this introduces some noise, since people may be more likely to order delivery when the weather is bad.
All in all, it took about 30 minutes to download the data and prompt Claude, and another 30 minutes to review Claude’s work. It took Claude about 10 minutes to do the analysis and another 20 minutes to handle revisions. If we had done this whole project without the use of AI, it probably would have taken us closer to 10 hours. (Rest assured that we carefully reviewed all of the code and analysis that Claude produced.)
Delivery spending isn’t increasing with income
If Yglesias’ affluence theory were true, we would expect to see richer people ordering more food delivery. But neither delivery transactions nor delivery spending increases as you move to higher income brackets.
The first chart below shows delivery transactions (roughly, how often you order delivery) per capita, broken out by income bracket; the second chart shows delivery spending by income bracket.
What about delivery spending as a share of household income? After all, spending $100 on delivery is much more of a splurge for a college student than for a professional in their 30s.
The data shows that delivery spending does, in fact, take a larger bite out of the paychecks of poor households.
Of course, some people are just bad with money (that’s true in every income bracket), but there are a few possible reasons for the pattern we see here. The first is that this is just what being poor is like: When you have less money, every individual expense takes up a larger portion of your income than it would if you had more money.
But also, poor people might be more likely to be short on time or unable to afford other splurges. If you’re working long hours for low pay, you might be too tired to cook when you get home. Maybe you would rather use that time to do something relaxing, like catch up on your favorite show or spend time with your family. And you might not be able to take your significant other on a nice vacation or buy them an expensive present, but maybe you can swing a DoorDash order to celebrate a special occasion together.
Could this be about food deserts?
In the 2000s, the argument that poor households were unable to eat healthily because they were disproportionately geographically located in areas that lacked access to nutritious food gained traction. Michelle Obama’s Let’s Move program and the Healthy Food Financing Initiative were built in part to address it. Rigorous social science has more recently proved that nutritional inequality is largely driven by demand, and only 10% can be attributed to access to healthy food.
But many people still believe in the food desert hypothesis or the complementary idea that groceries might be so expensive that DoorDash isn’t much more expensive by comparison.
To check this, we merged our data on delivery orders with USDA data on the share of the urban population living in food deserts by county.3
No dice. We found a modestly negative correlation between the share of the urban population living in food desert tracts and per-capita delivery transactions or spending. Counties in the top one-third of food desert concentration averaged about 40% less delivery spending per capita than those in the bottom one-third.
The availability of grocery stores was not a driving factor in whether someone used food delivery services; in fact, there was an inverse relationship between the two.
Our data isn’t perfect — the food desert data is from 2019, while the delivery data is from 2025, and it only captures card transactions. Still, we think it’s unlikely that poor households are substituting DoorDash for groceries.
DoorDash is a poor Millennial phenomenon, not a Gen Z one
Whether you look at delivery transactions per capita or dollars spent per capita, you can see that DoorDash isn’t a Gen Z phenomenon — it’s a Millennial one.
The people who order the most DoorDash aren’t the very young; they’re people in their early 30s to early 40s.4 More specifically, they’re people in their 30s and 40s who don’t make very much money.
Look at annualized delivery transactions, broken out by income bracket and generation. The biggest DoorDash customers are people in their early 30s who make $50,000 or less.
As it happens, “people in their early 30s and 40s who don’t make very much” is a group that is quite overrepresented in journalism. People who work at big publications also tend to have gone to good schools, which means that many of their peers probably earn above-average salaries. And people tend to compare their standard of living and consumption choices with those of their peers.
The entire DoorDash discourse may be more a product of the pundit class’ personal gripes than a real living standards crisis among America’s urban poor and middle class.
Related:
I can't stop yelling at Claude Code

They say that if you really want to know a person’s character, you should observe how she treats her servants. On Christmas vacation, I realized I didn’t like what this said about me.
No, Mr. President, I will not tip my plumber

I have never tipped a plumber. They are well-paid tradesmen who don’t depend on me slipping them some extra cash to make a living. They can ruthlessly dictate the price when you’re facing a sewage emergency or basement flood. Plus, they are supposed to offer an up-front quote for their services that lets you shop around — as long as you aren’t facing the immediate catastrophe of an exploded pipe.
Note that the Bureau of Labor Statistics includes takeout and delivery in the “food away from home” category.
Uber bought Postmates in 2020, and as of 2026, the Postmates app runs fully on Uber Eats’ platform.
The USDA defines urban food deserts as census tracts with (a) a poverty rate of at least 20% or a median family income below or equal to 80% of the state/metro median and (b) where either 500 or more people or at least 33% of the tract population live more than one-half a mile away from the nearest supermarket.
Note that some of the people in the 18 to 20 and 21 to 24 age buckets are probably using their parents’ accounts.
 | A guest post by
|
Former DD employee here. Can co-sign that the largest ordering segment was low SES millennials. I worked at Caviar which was eventually acquired by Doordash and my biggest shock post acquisition was how many low ticket size orders were going to low/middle income zips. Caviar only operated in big cities and our client base was wealthier. So it wasn't strange to see $200 of Han Dynasty going to the upper west side. But once inside Doordash, I was flabbergasted to see that their median order was a $12 junior bacon cheese burger meal going to a working-class neighborhood in Phoenix (+$10 in delivery fees, maybe a tip, maybe not. Sorry y'all. Doordash's hard data makes it clear that low income people are very bad tippers. $0 tips are WAY more common than you think. Doordash got sued for not giving all tip money directly to dashers. What you didn't see on the outside was that 100% of that money was making it to dashers, but they had some socialist redistribution going on to prevent anyone from ending up at the $0 tip. The lawsuit forced them to stop this practice)
I was so convinced that their business model was doomed to fail-propped up by stimulus checks from modest income housholds- that I sold all of my stock immediately after I left in '21. I greatly underestimated how many people are insanely bad with money.
Yes, there are some sympathetic cases in here of people with kids who want to save time but that's not most of what's going on. This is is driven by the same forces driving up gambling usage: a lack of cultural habits that engender pre-frontal cortex thinking/behavior.
When I read the headline and the opening anecdotes - about people spending hundreds of dollars on delivery each week while they earn $50,000 a year - I was shocked, and expected the data to show *a lot* of DoorDash transactions. But, in fact, even in the group that uses the service most often the spend is about 1% of income.
That factor should be given more weight in the writeup, or you should explain why you think DoorDash deliveries are only a very small part of the overall volume of deliveries from all delivery services. Based on the DoorDash data, the people in your splashy opening anecdotes are highly, highly unusual consumers - spending 30% of their total income or more on delivery – and so a *very* misleading illustration of the typical pattern.
It is interesting, I do take the point, that people in lower income categories are spending more as a percentage of income than people who are wealthier. One speculation: they can’t afford more expensive luxuries so this is a luxury they allow themselves once in a while. But very few people seem to be driving themselves to ruin like the very poor decision-makers in the anecdotes that lead the story.